

Image Details
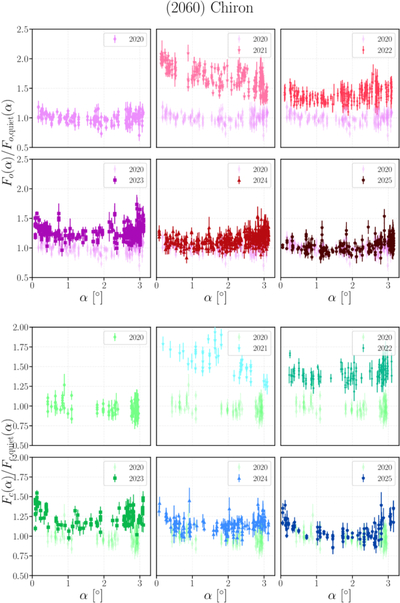
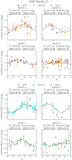
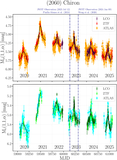
Caption: Figure 10.
Residual phase curves, converted to flux space, for Chiron after subtracting off the quiescent 2015–2019 phase-curve flux (M. M. Dobson et al. 2024) for (top) the color-shifted ATLAS o-band data and (bottom) the color-shifted ATLAS c-band data. Each panel represents a new observing season of data, with the 2020 phase curve included as a baseline for quiescent activity.
Other Images in This Article
Show More
Copyright and Terms & Conditions
© 2026. The Author(s). Published by the American Astronomical Society.

Copyright ©
2026 Astronomy Image Explorer. All Rights Reserved.
