

Image Details
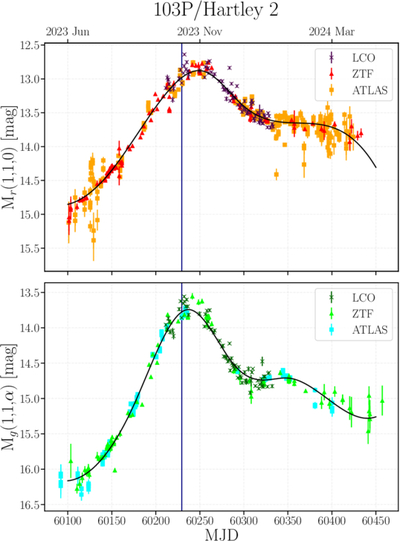
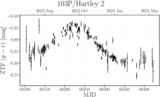
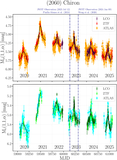
Caption: Figure 3.
Distance- and phase-corrected light curves for 103P/Hartley 2 color-shifted to (top) ZTF-r band and (bottom) to ZTF-g band. Note that no phase correction is applied to the g band (see Section 3). The different datasets are denoted via differing colors and markers. The solid black curve running over each dataset is a third-order polynomial spline fit. Overplotted in a solid navy line in both plots is the date of perihelion passage, 2023 October 12, for reference.
Other Images in This Article
Show More
Copyright and Terms & Conditions
© 2026. The Author(s). Published by the American Astronomical Society.

Copyright ©
2026 Astronomy Image Explorer. All Rights Reserved.
