

Image Details
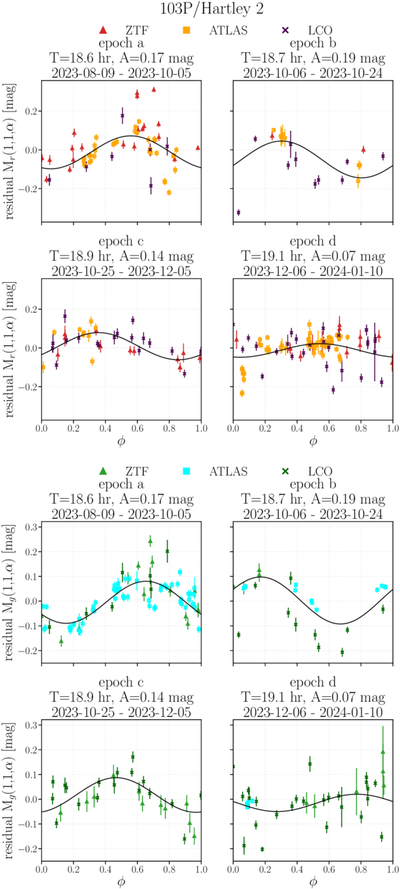
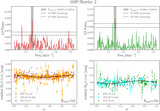
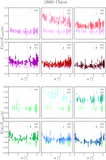
Caption: Figure 7.
Rotational phase-folded residual light curves for 103P using the same epochs, measured rotational periods T, and light-curve amplitudes A (denoted on top of each subplot) from T. Lehmann (2025) with our survey/telescope dataset. Top: data color-shifted to ZTF-r band. Bottom: data color-shifted to ZTF-g band. Overplotted in solid blue is the best-fit single-peaked sinusoid measured.
Other Images in This Article
Show More
Copyright and Terms & Conditions
© 2026. The Author(s). Published by the American Astronomical Society.

Copyright ©
2026 Astronomy Image Explorer. All Rights Reserved.
