

Image Details
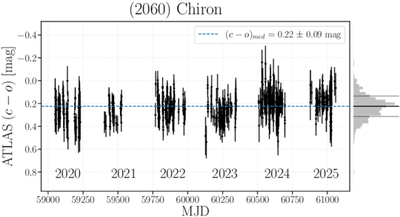
Caption: Figure 12.
Color evolution of Chiron in ZTF (g − r) as in Figure 11, this time using a nearest-neighbor approach with a time separation of ±2 days. Uncertainties are obtained from propagating the individual photometric uncertainties in quadrature. The dashed horizontal line in blue, the histogram, and its associated annotations are the same as in Figure 11.
Other Images in This Article
Show More
Copyright and Terms & Conditions
© 2026. The Author(s). Published by the American Astronomical Society.

Copyright ©
2026 Astronomy Image Explorer. All Rights Reserved.
