

Image Details
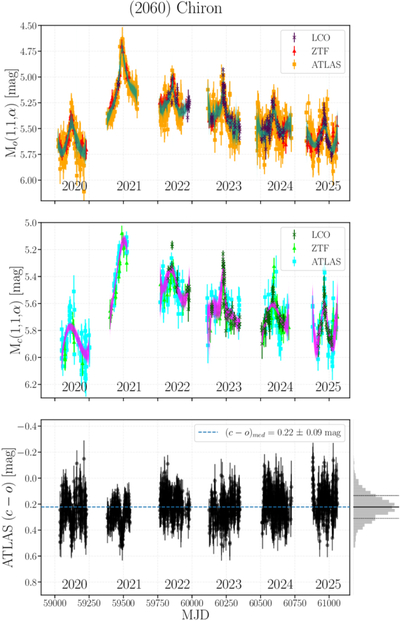
Caption: Figure 11.
Light curves of the color-shifted magnitudes of Chiron to (top) the ATLAS o band and (middle) the ATLAS c band. Overplotted on each are 105 synthetic Monte Carlo–sampled splines within measurement uncertainties. Bottom: the color evolution of Chiron in ATLAS (c − o) over the shared time range, with the uncertainty on each data point being estimated from the 1σ uncertainties of the splines. The dashed horizontal line in blue represents the median color across the dataset, and on the right is the histogram of the derived colors showing an approximate Gaussian distribution about the solid black line, with dashed black lines representing the standard deviation.
Other Images in This Article
Show More
Copyright and Terms & Conditions
© 2026. The Author(s). Published by the American Astronomical Society.

