

Image Details
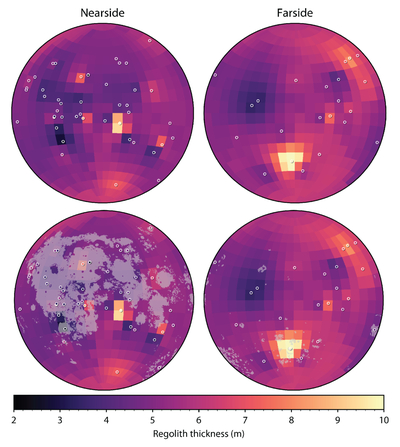
Caption: Figure 7.
(Top) Maps of the lunar nearside (left) and farside (right) showing estimated surface regolith thickness. Points outlined in white mark the locations of measured regolith thickness (Table A3). The color of each point denotes the measured regolith thickness at that location using the same color scale as the gridded map. The gridded map is derived from IDW estimation based on the measured thicknesses at 68 points (M. J. Jones & A. Rajšić 2026). Maps are shown in Lambert azimuthal equal area projection. (Bottom) Same maps, with maria regions shaded (according to D. Nelson et al. 2014).
Other Images in This Article
Copyright and Terms & Conditions
© 2026. The Author(s). Published by the American Astronomical Society.

Copyright ©
2026 Astronomy Image Explorer. All Rights Reserved.
