

Image Details
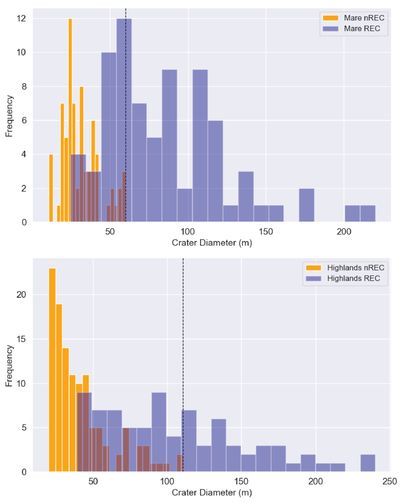
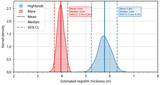
Caption: Figure 3.
(Top) Comparison of crater distributions in Lunar maria. The nREC crater population is shown in orange, and the REC in blue. Vertical dashed line marks the largest mapped nREC in the region (D = 60 m); (bottom) same for highlands. Vertical dashed line marks the largest mapped nREC in the region (D = 110.6 m)
Other Images in This Article
Copyright and Terms & Conditions
© 2026. The Author(s). Published by the American Astronomical Society.

Copyright ©
2026 Astronomy Image Explorer. All Rights Reserved.
