

Image Details
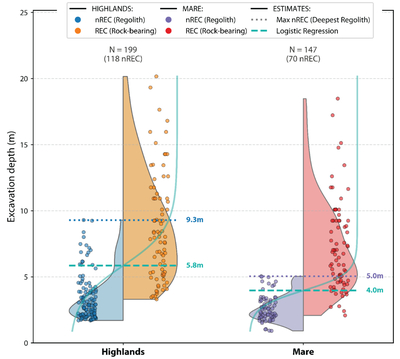
Caption: Figure 4.
Logistic regression analysis of rock excavation onset in the lunar highlands (left) and maria (right). Points show individual fresh craters classified as nonrocky ejecta (nREC; regolith-only excavation) and rocky ejecta (REC; rock excavation), plotted as excavation depth (0.084 × D) versus terrain group. Violin envelopes represent kernel density estimates of excavation depth distributions (area normalized to unity). The dashed horizontal lines indicate the traditional maximum-nREC estimate of regolith thickness (9.3 m for highlands; 5.0 m for maria). The solid curves show the fitted logistic regression models describing the probability of rocky ejecta as a function of excavation depth. The horizontal dashed green lines mark the logistic midpoint (D50), interpreted as the terrain-averaged onset of rock excavation (5.8 m for highlands; 4.0 m for maria).
Other Images in This Article
Copyright and Terms & Conditions
© 2026. The Author(s). Published by the American Astronomical Society.

