

Image Details
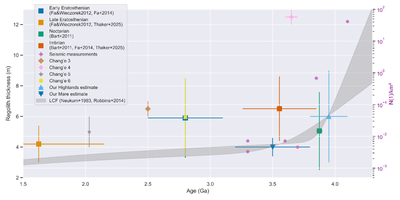
Caption: Figure 6.
Regolith thickness as a function of surface age, compared to the lunar chronology function (LCF). The literature measurements are shown with colored markers as indicated. The light and dark blue triangles represent terrain-averaged regolith thickness estimates derived in this study for the lunar highlands (upright triangles) and maria (inverted triangles). The associated ages represent characteristic formation ages of the highlands and maria rather than specific local surface ages. The complete dataset is provided in Table A3. The LCF is plotted against the y-axis on the right, using the models of G. Neukum (1983) and S. J. Robbins (2014), and is shown for temporal context rather than as a fit to the regolith-thickness data.
Other Images in This Article
Copyright and Terms & Conditions
© 2026. The Author(s). Published by the American Astronomical Society.

