

Image Details
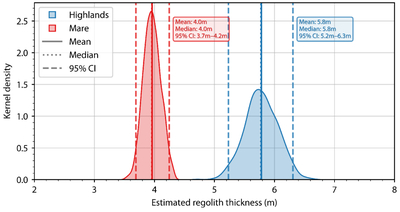
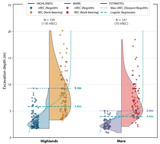
Caption: Figure 5.
Bootstrap distributions of terrain-averaged regolith thickness derived from logistic regression analysis (1000 stratified resamples per terrain). Each curve represents the kernel density estimate (KDE; area normalized to unity) of transition depths (D50) obtained by refitting the logistic model to resampled crater populations while preserving the REC/nREC ratio within each terrain. Red corresponds to mare terrains and blue to highlands. Solid vertical lines denote the mean transition depth, dotted lines indicate the median, and dashed lines mark the 95% confidence interval (2.5–97.5 percentiles).
Other Images in This Article
Copyright and Terms & Conditions
© 2026. The Author(s). Published by the American Astronomical Society.

Copyright ©
2026 Astronomy Image Explorer. All Rights Reserved.
