Image Details
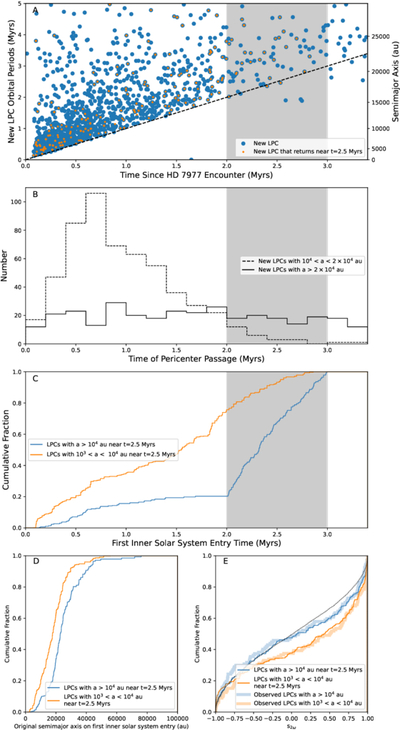
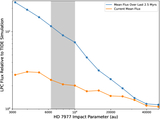
Caption: Figure 4.
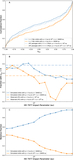
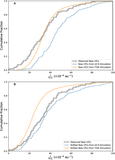
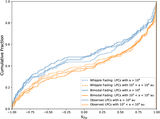
(a) Plot of LPC orbital period vs. perihelion passage time for LPCs making their first perihelion passage inside 4 au in the Flyby_7943 simulation. LPCs overplotted in orange go on to make returning passages inside 4 au with 103 au < a < 104 au at 2–3 Myr after HD 7977’s passage (time range shaded in gray). (b) Distribution of first perihelion passage times inside 4 au. Time distributions are shown for LPCs with a > 2 × 10⁴ au (solid) and with 104 au < a < 2 × 10⁴ au (dashed). (c) For LPCs making perihelion passages 2–3 Myr after HD 7977’s passage, the distribution of times at which they make their first inner solar system perihelion passage is shown. Distributions are shown for LPCs with a > 104 au (blue) and with 103 au < a < 104 au (orange). LPC contributions to the distributions are weighted with Equation (1). (d) For LPCs making perihelion passages 2–3 Myr after HD 7977’s passage, the distribution of the semimajor axes they possess on their first perihelion passage through the inner solar system is shown. Distributions are shown for LPCs with a > 104 au (blue) and with 103 au < a < 104 au (orange). LPC contributions to the distributions are weighted with Equation (1). (e) For LPCs making perihelion passages 2–3 Myr after HD 7977’s passage, the s2ω distributions they have on these perihelion passages are shown. Distributions are shown for LPCs with a > 104 au (blue) and with 103 au < a < 104 au (orange). LPC contributions to the distributions are weighted with Equation (1).
Other Images in This Article
Copyright and Terms & Conditions
© 2026. The Author(s). Published by the American Astronomical Society.