Image Details
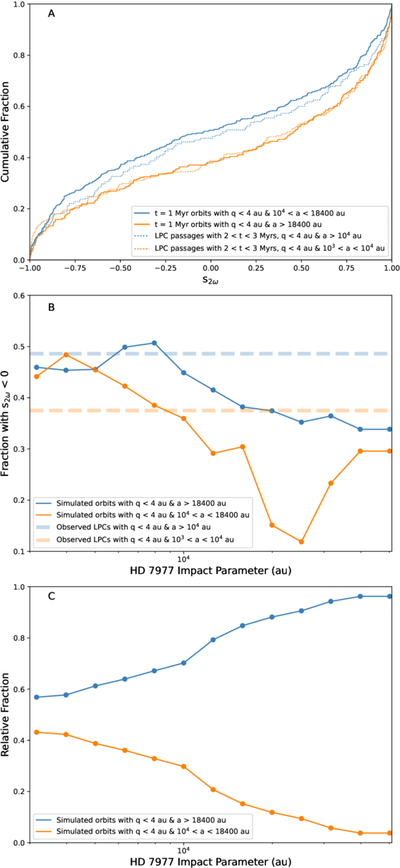
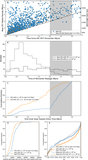
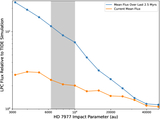
Caption: Figure 5.
(a) For the Flyby_7943 simulation, the distribution of s2ω at t = 1 Myr is shown for q < 4 orbits with a > 18,400 au (solid blue) and with 104 au < a < 18,400 au (solid orange). Orbits are weighted by their orbital frequency. The s2ω distribution is also shown for LPCs making q < 4 au perihelion passages 2–3 Myr after HD 7977’s encounter, weighted using Equation (1). Distributions are shown for LPCs with a > 104 au (dotted blue) and with 103 au < a < 104 au (dotted orange). (b) For each of our HD 7977 passage simulations, the fraction of q < 4 au orbits with s2ω < 0 at t = 1 Myr is plotted against HD 7977’s impact parameter. These fractions are calculated for orbits with a > 18,400 au (blue) and with 104 au < a < 18,400 au (orange). Dashed lines mark the fractions for observed dynamically new LPCs (blue) and observed young returning LPCs (orange). (c) At t = 1 Myr, the relative fractions of q < 4 au orbits with a > 18,400 au (blue) and with 104 au < a < 18,400 au (orange) are plotted against HD 7977’s impact parameter.
Other Images in This Article
Copyright and Terms & Conditions
© 2026. The Author(s). Published by the American Astronomical Society.