Image Details
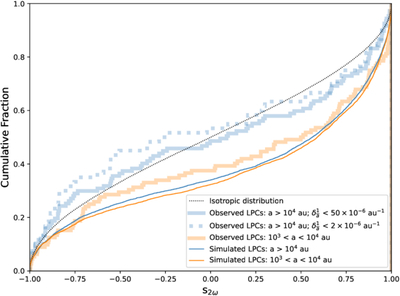
Caption: Figure 2.
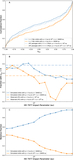
The cumulative distribution of s2ω is shown for observed LPCs (thick lines) and simulated LPCs from the TIDE simulation (thin lines). LPCs are split into dynamically new comets (a > 104 au; blue) and returning comets with 103 au < a < 104 au (orange). Among observed LPCs, we only consider comets discovered since 1990, and we also require uncertainties below 50 × 10−6 au−1 in the original semimajor axes of our dynamically new LPCs (M. Królikowska & P. A. Dybczyński 2019). The dashed blue line is for observed dynamically new LPCs with original semimajor-axis uncertainties below 2 × 10⁻⁶ au−1. The dotted line marks a completely isotropic distribution of orbit orientations.
Other Images in This Article
Copyright and Terms & Conditions
© 2026. The Author(s). Published by the American Astronomical Society.