Image Details
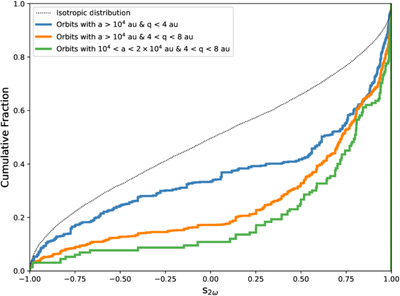
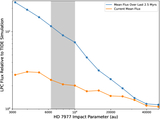
Caption: Figure 3.
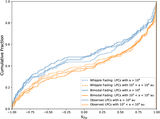
The distribution of s2ω for Oort cloud orbits in 10 coadded snapshots of our TIDE simulation (t = 1.1–2.0 Gyr in 100 Myr increments). Distributions are shown for orbits with q < 4 au and a > 104 au (blue), orbits with 4 au < q < 8 au and a > 104 au (orange), and orbits with 4 au < q < 8 au and 104 au < a < 2 × 10⁴ au (green). Each orbit is weighted by its orbital frequency (a−1.5). The dotted line marks an isotropic distribution.
Other Images in This Article
Copyright and Terms & Conditions
© 2026. The Author(s). Published by the American Astronomical Society.
Copyright ©
2026 Astronomy Image Explorer. All Rights Reserved.