Image Details
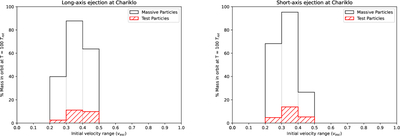
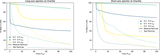
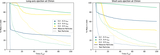
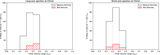
Caption: Figure 7.
Mass in orbit at t = 100 Trot per initial vejection bin for a landslide ejection from the long axis (left panel) and short axis (right panel). Test particle regoliths are marked by the red hatches and massive particle regoliths by the black solid lines. Here we can see the amount of regolith captured in each initial velocity bin at the end of our simulations. We see high levels of capture up to ∼95% in the massive particle case in the right panel.
Other Images in This Article
Copyright and Terms & Conditions
© 2026. The Author(s). Published by the American Astronomical Society.
Copyright ©
2026 Astronomy Image Explorer. All Rights Reserved.