Image Details
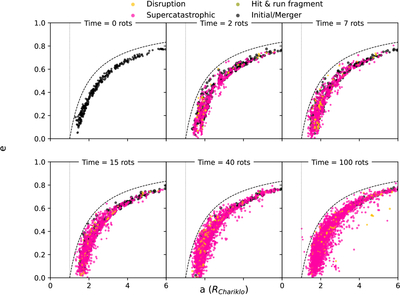
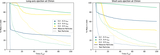
Caption: Figure 4.
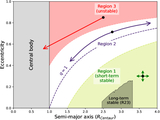
Semimajor axis vs. eccentricity (a versus e) plot of regolith capture of the same simulation in Figure 3. We show a landslide-like ejection from the long axis with the initial vejection = 0.2−0.5 vescape. The black dashed line is the pericenter curve q = 1 RChariklo and the gray dotted line is a = 1 RChariklo. The regolith particles are dynamically excited and bounce back and forth along the pericenter curve because of the ellipsoidal Centaur. Collisions between particles damp their energy and push them further under the pericenter curve.
Other Images in This Article
Copyright and Terms & Conditions
© 2026. The Author(s). Published by the American Astronomical Society.
Copyright ©
2026 Astronomy Image Explorer. All Rights Reserved.