

Image Details
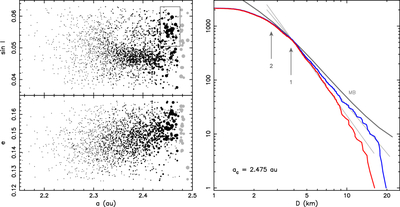
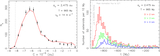
Caption: Figure 6.
Low-albedo asteroids in our canonical classification of the Eulalia family with ac = 2.475 au and limiting C⋆ = −8.14 × 10⁻⁵ au. The left panels show the projection of family members to the planes defined by proper semimajor axis and sine of inclination (top), and proper semimajor axis and eccentricity (bottom). The symbol sizes scale with asteroid diameter. The black and gray symbols are cluster members with a < ac and a > ac, respectively. The right panel shows the cumulative SFD of the family population with a < ac, assuming the objects have a mean albedo value of pV = 0.055. The blue curve corresponds to the entire cluster. The red curve corresponds to the population where H < 14 objects in the rectangle shown in the top-left panel were excluded (these objects may belong to the older and larger Polana family, centered on (142) Polana with proper eccentricity of 0.1574 and sine of proper inclination of 0.0577). The light-gray lines are power-law fits to the populations in the (4, 11) km size range with slope values −2.95 (blue population) and −3.42 (red population). The dark-gray curve (labeled MB) is the main belt SFD from W. F. Bottke et al. (2020). We shifted the main belt SFD downward by a factor of ≃200, such that it approximately matches the Eulalia SFD over the ≃(2.8, 4) km interval. This similarity indicates the slope change at ≃4 km stems from collision evolution (arrow labeled 1), while the second slope change at ≃2.8 km is from observational incompleteness (arrow labeled 2).
Other Images in This Article
Show More
Copyright and Terms & Conditions
© 2026. The Author(s). Published by the American Astronomical Society.

