

Image Details
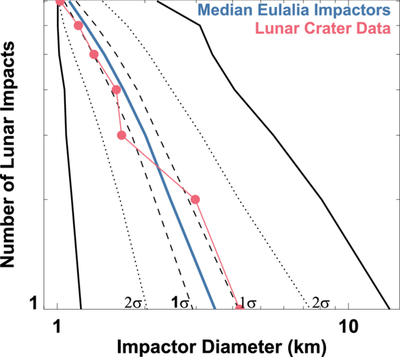
Caption: Figure 18.
The range of stochastic impacts on the Moon from the Eulalia impact shower. Using a Monte Carlo code, we performed 10,000 simulations to track seven projectiles striking the Moon. The solid black curves represent the maximum range of impactor diameters determined from these simulations. The long-dashed and short-dashed black lines indicate the 1σ and 2σ ranges from the ensemble, respectively, while the blue curve represents the median impactor diameter. The red dots correspond to large lunar craters from Figure 2 that have ages similar to that of Copernicus crater. A comparison between model and observations show the model impact shower generally falls within the 1σ range.
Other Images in This Article
Show More
Copyright and Terms & Conditions
© 2026. The Author(s). Published by the American Astronomical Society.

