

Image Details
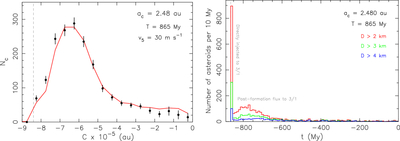
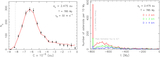
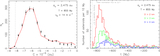
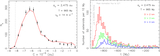
Caption: Figure 11.
Modeling the dynamical evolution of the Eulalia family with the center ac = 2.48 au, closer to the J3:1 than our canonical choice. The vertical dashed line in the left panel shows the C⋆-value, though our data (black symbols with formal uncertainties) continue formally farther due to finite bin size and a limited mobility population of objects in the bin containing the C⋆-value. This solution used the bulk density ρ = 1.3 g cm−3, the surface thermal inertia Γ = 230 SI units, and the variable YORP timescale τ0 = 1 My. The best match to the data (left panel) is obtained for T = 865 My and v5 = 30 m s−1 (recall that the characteristic initial ejection velocity is vej(D) = v5 (5 km/D) in meters per second). Here, the small initial distance to the J3:1, combined with a high initial ejection velocity, produces a significant spike in fragment delivery at the family formation event (right panel). With that said, more than twice as many fragments drift to the J3:1 over the next ≃200 My. The overall yield to the resonance is the largest from all solutions shown. Both ordinates are calibrated to the adopted family identification without correcting for its incompleteness.
Other Images in This Article
Show More
Copyright and Terms & Conditions
© 2026. The Author(s). Published by the American Astronomical Society.

