Image Details
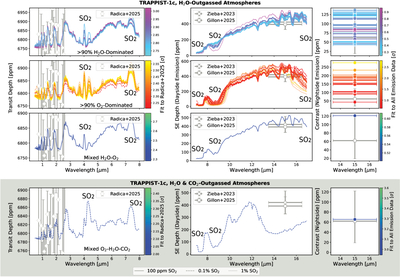
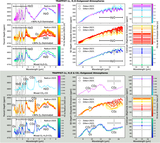
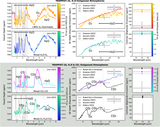
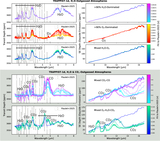
Caption: Figure 11.
Same as Figure 6, but for the SO2-bearing atmospheres of T-1 c. Solid, dashed, and dotted lines indicate that 100 ppm, 0.1%, or 1% SO2, respectively, was added to the bottom layer of the atmosphere. When including SO2, the no mixed CO2–CO, and H2O–CO2 outgassed, O2-dominated atmospheres were found to be stable, so those rows are not present in this figure. When including trace SO2, all types of H2O outgassed atmospheres may provide good (<1σ) fits to all available emission data.
Other Images in This Article
Show More
Copyright and Terms & Conditions
© 2026. The Author(s). Published by the American Astronomical Society.
Copyright ©
2026 Astronomy Image Explorer. All Rights Reserved.