Image Details
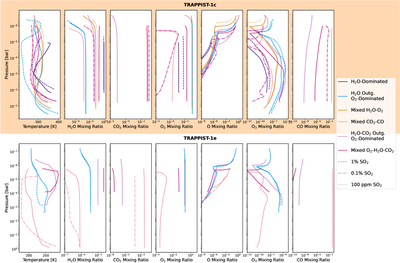
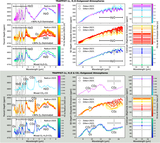
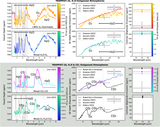
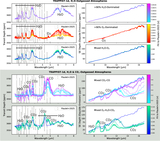
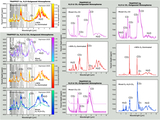
Caption: Figure 2.
Examples illustrating the compositional and pressure–temperature ranges of the atmospheric archetypes found in this study. Temperature and gas mixing ratio profiles (as a function of atmospheric pressure) for H2O, CO2, O2, O, O3, and CO are shown for examples of every archetype atmosphere for T-1 c and e. The top row (peach colored background) shows profiles for T-1 c and the bottom row (white colored background) shows T-1 e profiles. When available, atmospheric cases are shown both without (solid lines) and with SO2 contributions of either 1% (dashed line), 0.1% (dashed–dotted line), or 100 ppm (dotted line) injected into the bottom layer.
Other Images in This Article
Show More
Copyright and Terms & Conditions
© 2026. The Author(s). Published by the American Astronomical Society.