Image Details
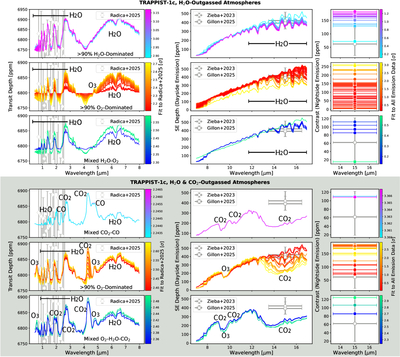
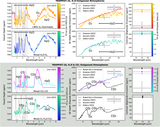
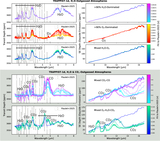
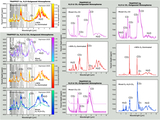
Caption: Figure 6.
Transmission and emission spectra for all stable atmospheres found for T-1 c (without trace SO2). The top three rows (white background) and bottom three rows (gray background) show atmospheres sourced from H2O and H2O–CO2 outgassing, respectively. Each row corresponds to a different atmospheric archetype (described in text), from top to bottom: H2O dominated; O2 dominated (produced via H2O outgassing); mixed H2O2; mixed CO2–CO; O2 dominated (produced via H2O–CO2 outgassing); and mixed O2–H2O–CO2. The left column shows visible to near-infrared transmission spectra (0.001–6.5 μm); the middle column shows secondary eclipse emission spectra at thermal wavelengths (8–17 μm); and the right column shows nightside thermal emission at 15 μm. The transmission spectra are colored by their fit (σ deviation) to available T-1 c transmission data (M. Radica et al. 2025), and the emission data are colored by their combined fit to all available emission data (15 μm day and night points; S. Zieba et al. 2023; M. Gillon et al. 2026). Spectral features are labeled with the absorbing gas. The overall best-fitting atmospheres for T-1 c include lower-pressure (<0.2 bar), O2-dominated atmospheres (regardless of outgassing source) and mixed O2–H2O atmospheres.
Other Images in This Article
Show More
Copyright and Terms & Conditions
© 2026. The Author(s). Published by the American Astronomical Society.