Image Details
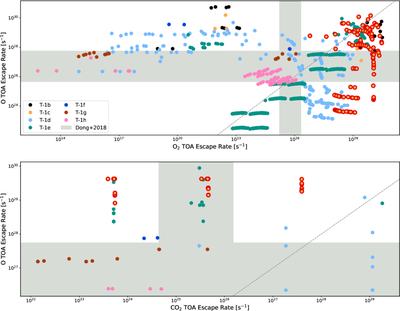
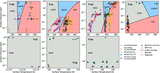
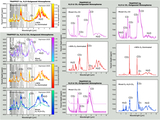
Caption: Figure 5.
The escape fluxes (in s−1 units) found across all stable atmospheres for all planets. Top panel shows the O vs. O2 escape flux, and the bottom panel shows the O vs. CO2 escape flux (for atmospheres including CO2 outgassing). For T-1 b and c, models that fit the available emission data to <3σ are denoted by red rings. The gray regions indicated the range of escape rates (across all seven planets) found by C. Dong et al. (2018). The models that best fit the T-1 b and c emission data tend to have higher O and O2 escape rates.
Other Images in This Article
Show More
Copyright and Terms & Conditions
© 2026. The Author(s). Published by the American Astronomical Society.
Copyright ©
2026 Astronomy Image Explorer. All Rights Reserved.