Image Details
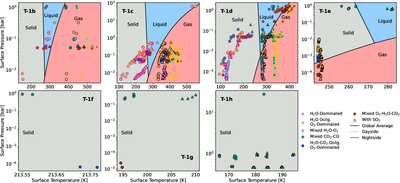
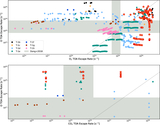
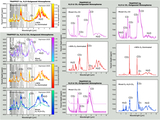
Caption: Figure 4.
Surface pressure–temperature (P–T) points for each atmosphere in our work for each planet. Points are shown plotted over the phase diagram for water, where the gray, blue, and red shaded regions indicate solid, liquid, and gas phases, respectively. Points are colored by atmospheric composition (see figure legend). Globally averaged P–T pairs are shown with black borders, and dayside and nightside profiles for T-1 b, c, and d are shown with yellow and magenta borders, respectively. Atmospheres containing SO2 are shown by triangle points. T-1 d and e both have atmospheres that may be fully contained in the liquid water region of the phase diagram.
Other Images in This Article
Show More
Copyright and Terms & Conditions
© 2026. The Author(s). Published by the American Astronomical Society.