Image Details
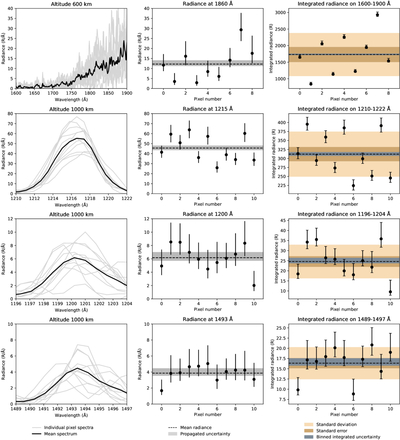
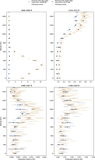
Caption: Figure 8.
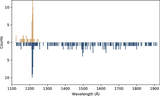
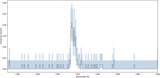
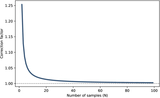
Illustration of pixel binning and uncertainty estimation, for Titan flyby T10 on 2006 January 15. Data were taken from limb observations at 600 and 1000 km altitudes. Left panels: Individual pixel spectra (light gray lines) and mean spectrum (thick black line) obtained after binning. Central panels: individual pixel radiances with propagated uncertainties at specific wavelengths: 1850 Å for haze scattering; 1215 Å (Lyα); and 1200 and 1493 Å (nitrogen fragment lines). The dashed black line and shaded region represent the mean radiance and its propagated uncertainty, respectively. Right panels: integrated radiances over the wavelength intervals 1600–1900 Å, top (continuum); and 1210–1222 Å, 1196–1204 Å, 1489–1497 Å, and other rows (single lines). Individual spectral integrals with uncertainties propagated in the integration (black points) are compared with the mean radiance (dashed line), the integrated averaged uncertainty (blue region), the corrected standard error (dark orange region), and the standard deviation (light orange region) of the single pixel values.
Other Images in This Article
Copyright and Terms & Conditions
© 2026. The Author(s). Published by the American Astronomical Society.