Image Details
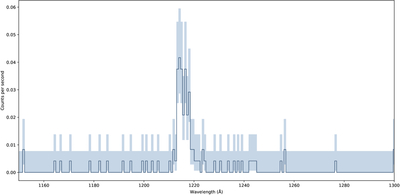
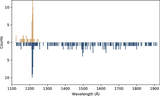
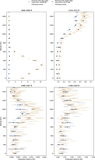
Caption: Figure 6.
Example of raw spectral data from 2006 January 15 (flyby T10) showing the count rate (in counts per second) as a function of wavelength (in angstroms). The signal corresponds to the uncalibrated detector output from the FUV channel, truncated around 1216 Å, and includes the associated 1σ Poisson uncertainties (Garwood interval), represented as the shaded region, illustrating nonzero uncertainties even for pixels with zero counts.
Other Images in This Article
Copyright and Terms & Conditions
© 2026. The Author(s). Published by the American Astronomical Society.
Copyright ©
2026 Astronomy Image Explorer. All Rights Reserved.