Image Details
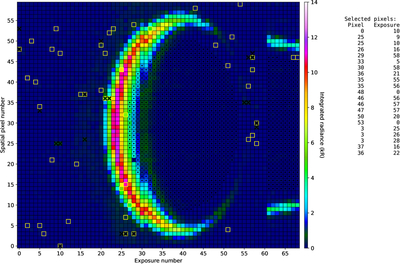
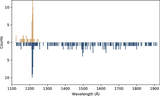
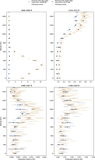
Caption: Figure 3.
Screenshot of the stellar contamination identification widget for Titan flyby T10 on 2006 January 15, in the FUV channel. For illustration purposes, all spectra are integrated here between 1600 and 1900 Å and represented as a color map (here in kR units) for each spatial pixel (y-axis) with respect to each exposure (x-axis). Squares outlined in yellow are pixels pointing toward a star from the A. Pickles & É. Depagne (2010) catalog. Squares with a black dot represent pixels pointing toward Titan’s disk. When a pixel is identified as contaminated, it is marked with a black cross.
Other Images in This Article
Copyright and Terms & Conditions
© 2026. The Author(s). Published by the American Astronomical Society.
Copyright ©
2026 Astronomy Image Explorer. All Rights Reserved.