Image Details
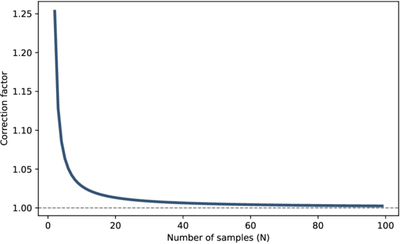
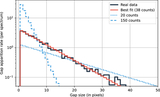
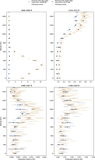
Caption: Figure 7.
Correction factor κ as a function of the number of pixels in the bin N. The dashed line represents the limit value of one as N tends to infinity.
Other Images in This Article
Copyright and Terms & Conditions
© 2026. The Author(s). Published by the American Astronomical Society.
Copyright ©
2026 Astronomy Image Explorer. All Rights Reserved.