Image Details
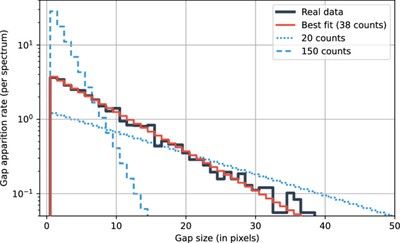
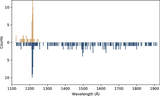
Caption: Figure 4.
Gap histogram for different cases. Real data from 2006 January 15 (solid dark line) are shown alongside the best fit (red solid line). A histogram is created in the 1600–1850 Å range in the FUV channel where no signal other than noise is identified. The dotted and dashed lines are presented to illustrate the effect of changing the initial count in the model.
Other Images in This Article
Copyright and Terms & Conditions
© 2026. The Author(s). Published by the American Astronomical Society.
Copyright ©
2026 Astronomy Image Explorer. All Rights Reserved.