

Image Details
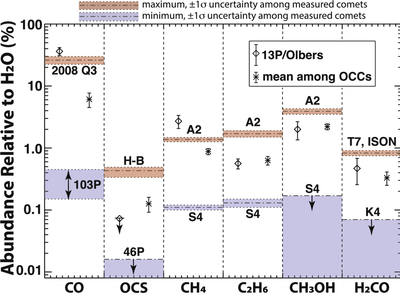
Caption: Figure 6.
Abundance ratios and ±1σ uncertainties for six trace species relative to H2O in 13P, together with minimum, maximum, and mean values measured among comets (excluding 13P), again showing its enriched abundances of CO and CH4 as are illustrated spectrally in Figures 2(a)–(b) and in Figures 3 and 4, respectively, yet near-mean abundances of C2H6 and CH3OH. For identities of the comets (abbreviated here) having measured minimum and maximum values, see Table 3, note b.
Other Images in This Article
Copyright and Terms & Conditions
© 2026. The Author(s). Published by the American Astronomical Society.

Copyright ©
2026 Astronomy Image Explorer. All Rights Reserved.
