

Image Details
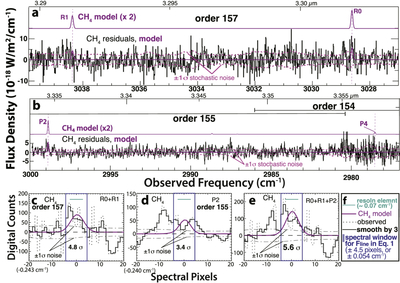
Caption: Figure 4.
(a–b) Comet 13P CH4 residual spectra, representing observed spectra after subtracting modeled continuum and line emission from other co-measured species. (c–e) Expanded spectral profiles of CH4 residual emission encompassing ~0.5 cm−1 and centered on the respective Doppler-shifted line frequencies. The spectral resolution element (horizontal green line) corresponds to resolving power RP ﹩\cong ﹩ 45,000. (f) Legend to panels (c)–(e). Horizontal green bar: spectral resolution element corresponding to RP = 45,000. Magenta trace: modeled CH4 emission (as in Figure 3 and panels (a) and (b)). Vertical blue bars: spectral interval used to capture the complete line flux (Fline; see Equation (1)); signal was summed over 9 spectral pixels, spanning ~0.108 cm−1, within which detection/confidence limits (expressed as multiples of σ) are listed.
Other Images in This Article
Copyright and Terms & Conditions
© 2026. The Author(s). Published by the American Astronomical Society.

