

Image Details
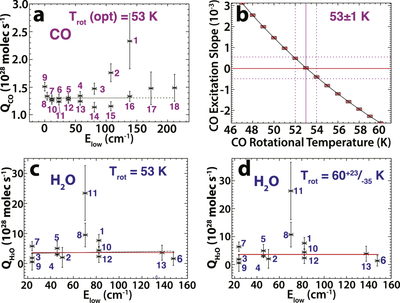
Caption: Figure 5.
Excitation analysis for Comet 13P/Olbers. (a) Line-by-line nucleus-centered CO production rates (Section 4.1). (b) Linear least-squares slope fit as a function of rotational temperature, with the best-fit (optimal) Trot (53 ± 1 K) corresponding to a slope of zero (the horizontal red line). (c) Line-by-line H2O production rates for Trot (opt) = 53 K. (d) Same as panel (c), but for its formal best-fit Trot using the 13 brightest water lines. For both CO and H2O, line numbers correspond to those assigned (arbitrarily) in Figure 2(a). Details are given in Section 3.3.
Other Images in This Article
Copyright and Terms & Conditions
© 2026. The Author(s). Published by the American Astronomical Society.

Copyright ©
2026 Astronomy Image Explorer. All Rights Reserved.
