

Image Details
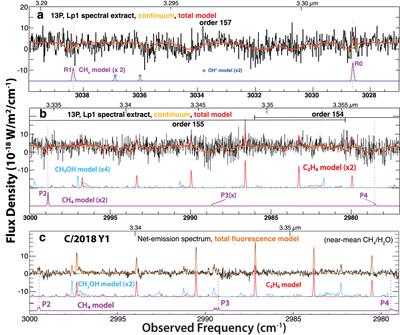
Caption: Figure 3.
(a–b). Nucleus-centered spectra of 13P in orders containing the lines of CH4 used in our analysis. Comparing relative intensities of CH4, C2H6, and CH3OH lines in 13P (panel (b)) with those in OCC 2018 Y1 (panel (c)) illustrates the enriched CH4 abundance in 13P (see Section 3.2 for detailed discussion).
Other Images in This Article
Copyright and Terms & Conditions
© 2026. The Author(s). Published by the American Astronomical Society.

Copyright ©
2026 Astronomy Image Explorer. All Rights Reserved.
