

Image Details
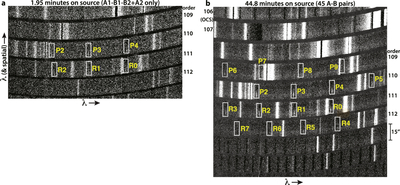
Caption: Figure 1.
Portions of 13P raw M2 difference frames (A–B) representing (a) the first ABBA sequence and (b) the full integration sequence. In each panel, the A-beam signal is bright, and the B-beam is dark. CO line positions are marked by rectangular boxes, and lines are labeled by their rotational designations. Also labeled in panel (b) are two orders containing OCS v3-band emissions (Section 4.4.2).
Other Images in This Article
Copyright and Terms & Conditions
© 2026. The Author(s). Published by the American Astronomical Society.

Copyright ©
2026 Astronomy Image Explorer. All Rights Reserved.
