Image Details
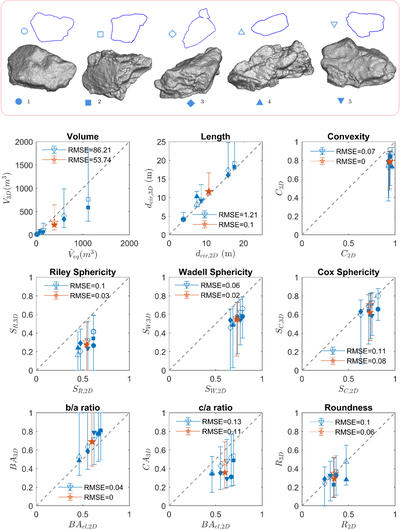
Caption: Figure 9.
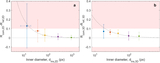
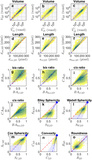
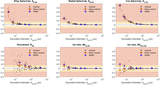
Size and shape measurement results from the 2D (x-axis) and 3D (y-axis) analyses of boulders observed on Bennu’s surface using OCAMS (2D outlines) and OLA (3D volumes), respectively. Empty blue markers and error bars represent 3D estimates derived from 2D OCAMS images. Filled blue markers indicate 3D measurements from reconstructed OLA volume. Red star markers indicate the measured averages for the five different boulders analyzed (filled stars: true 3D values from OLA data; empty stars: 3D estimates derived from OCAMS images). The dashed lines represent the 1:1 slope (i.e., P2D = P3D).
Other Images in This Article
Show More
Copyright and Terms & Conditions
© 2026. The Author(s). Published by the American Astronomical Society.
Copyright ©
2026 Astronomy Image Explorer. All Rights Reserved.