Image Details
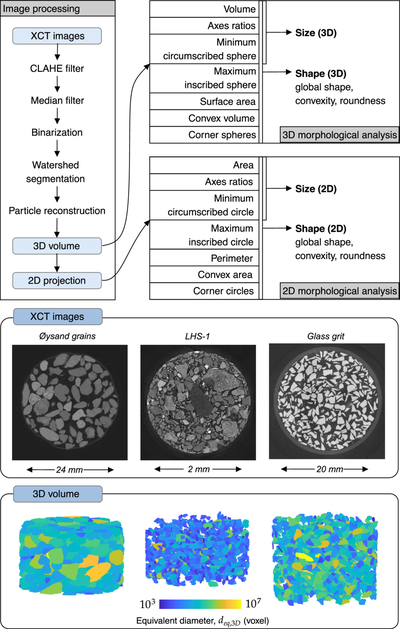
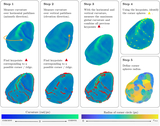
Caption: Figure 1.
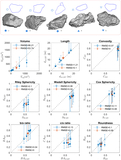
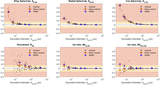
Flowchart of the XCT image processing and the parameters computed for the 2D and 3D morphological analyses. The Øysand grains (left), LHS-1 (middle), and glass grit (right) are shown as 2D grayscale XCT image slices along with their associated 3D representations from all slices analyzed. The color bar indicates the relative grain size (equivalent diameter) for each material.
Other Images in This Article
Show More
Copyright and Terms & Conditions
© 2026. The Author(s). Published by the American Astronomical Society.
Copyright ©
2026 Astronomy Image Explorer. All Rights Reserved.