Image Details
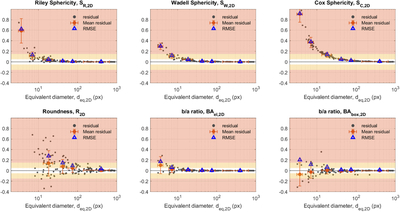
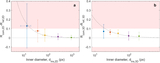
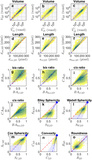
Caption: Figure 10.
Residuals of morphological parameters measured at different particle resolutions (deq,2D, in pixels). The red markers and error bars represent the mean and standard deviation of the residuals for the different size ranges shown in Figure 11. Blue triangle markers indicate the RMSE. The red and yellow shaded areas represent errors over ±0.15 and ±0.05, respectively.
Other Images in This Article
Show More
Copyright and Terms & Conditions
© 2026. The Author(s). Published by the American Astronomical Society.
Copyright ©
2026 Astronomy Image Explorer. All Rights Reserved.