Image Details
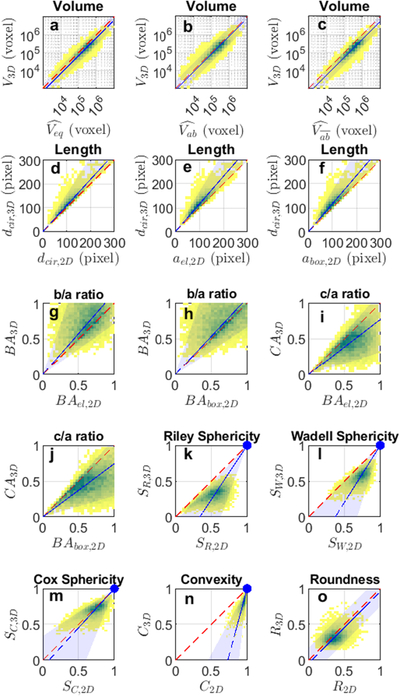
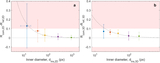
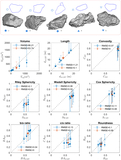
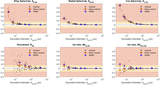
Caption: Figure 8.
Size and shape measurement results from the 2D and 3D analyses. 3D measurements (y-axis) are plotted as a function of their 2D measurements (x-axis) using a yellow–green density map. The shaded blue area covers 95% of all 2D projections, and the blue line represents the median. See the main text for definitions. The red dashed line represents the 1:1 line.
Other Images in This Article
Show More
Copyright and Terms & Conditions
© 2026. The Author(s). Published by the American Astronomical Society.
Copyright ©
2026 Astronomy Image Explorer. All Rights Reserved.