Image Details
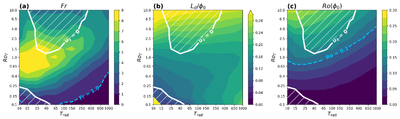
Caption: Figure 12.
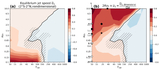
Diagnostics for the existence of RK instability in the suite of axisymmetrically forced simulations. Shading shows (a) Froude number, (b) ratio of the equatorial Rossby deformation radius to the latitude of maximum zonal wind speed, and (c) Rossby number at the latitude of maximum zonal wind speed. Dotted blue lines in panels (a) and (c) indicate the lower bounds for RK instability from P. Wang & J. L. Mitchell (2014). The hatched regions enclosed by solid white contours delineate the regions of the (RoT, Trad) phase space that superrotate.
Other Images in This Article
Show More
Copyright and Terms & Conditions
© 2026. The Author(s). Published by the American Astronomical Society.
Copyright ©
2026 Astronomy Image Explorer. All Rights Reserved.