Image Details
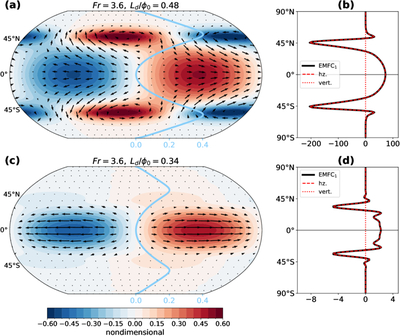
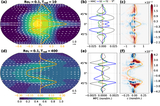
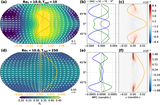
Caption: Figure 4.
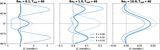
RK eigenmodes with E = 0, ﹩{ \mathcal S }=0.05﹩, and Trad = 200. (a) Upper-layer geopotential ﹩{{\rm{\Phi }}}_{1}^{{\prime} }﹩ (shading) and wind ﹩{{\boldsymbol{u}}}_{1}^{{\prime} }﹩ (arrows), for RoT = 10 and α = 0, corresponding to Fr = 3.6 and Ld/ϕ0 = 0.48. The thick blue line shows the local Rossby number, i.e., RoT times the background wind profile (scale at the bottom of the panel). (b) Upper-layer EMFC and its decomposition, as in Figure 2(b). (c, d) Same as panels (a) and (b), except with RoT = 2.5 and α = 0.5, corresponding to Fr = 3.6 and Ldϕ0 = 0.34. The mode amplitudes are normalized by their mean upper-layer kinetic energy.
Other Images in This Article
Show More
Copyright and Terms & Conditions
© 2026. The Author(s). Published by the American Astronomical Society.