Image Details
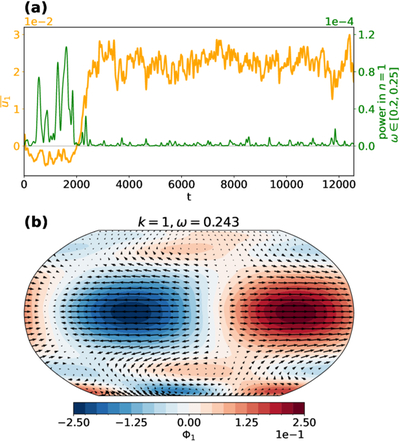
Caption: Figure 8.
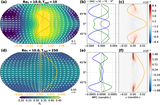
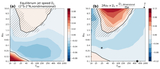
RK mode in a high-RoT tidally locked simulation (RoT = 10, Trad = 250). (a) Time series of equatorial RK mode power, as measured as the power contained in the [0.2, 0.25] frequency band of the k = 1 equatorial zonal wind (green line), along with time series of the equatorial zonal-mean zonal wind (orange line). Both time series are smoothed with a Gaussian filter with standard deviation 4π (1 rotation period). (b) Upper-layer geopotential and winds filtered for k = 1 and ﹩\omega ={\omega }_{{\rm{\max }}}﹩, where ﹩{\omega }_{{\rm{\max }}}﹩ is the frequency that has maximal EMFC contribution over 30∘S–30∘N for t ≤ 2000 (see text).
Other Images in This Article
Show More
Copyright and Terms & Conditions
© 2026. The Author(s). Published by the American Astronomical Society.