Image Details
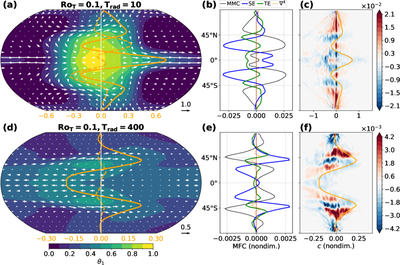
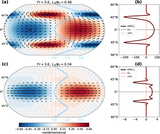
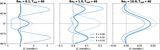
Caption: Figure 6.
Equilibrium properties of two RoT = 0.1 tidally locked simulations, with (a–c) Trad = 10 and (d–f) Trad = 400. (a, d) Mean upper-level potential temperature (shading) and winds (arrows). Orange lines show ﹩\overline{[{u}_{1}]}﹩ (solid) and ﹩\overline{[{v}_{1}]}﹩ (dashed, multiplied by 5 for visibility), with a scale shown at the bottom of each axis. (b, e) Upper-level zonal-mean zonal momentum budget (Equation (30)) in equilibrium. Shown are the contributions of the MMC (black), SEs (blue), TEs (green), and hyperdiffusion (dotted orange). The small residual due to ﹩[{\partial }_{t}\overline{{u}_{1}}]﹩ and numerical diffusion in the time-stepping scheme is shown as a thin red line. (c, f) Cospectra of upper-level transient EMFC in (latitude, phase speed) space. See Appendix E for definition. Solid orange lines show ﹩\overline{[{u}_{1}]}﹩; Rossby waves generated at high latitudes preferentially break and deposit westward momentum along these lines.
Other Images in This Article
Show More
Copyright and Terms & Conditions
© 2026. The Author(s). Published by the American Astronomical Society.