Image Details
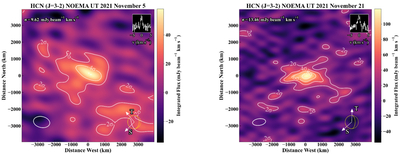
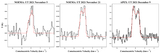
Caption: Figure 1.
Spectrally integrated flux maps for HCN (J = 3–2) detections on November 5 (left) and November 21 (right) with NOEMA. In the bottom left of the map, we display the size and orientation of the synthesized beam. The lower right of the map indicates the comet’s illumination, the Sun’s orientation (S), and the dust trail (T), while the upper right panel displays the spectral line extracted from the brightest pixel. For November 5, the rms noise is 9.62 mJy beam−1 km s−1, with the contours drawn from 2σ to 4σ. For November 21, the rms noise is 13.46 mJy beam−1 km s−1, with the contours drawn from 2σ to 8σ.
Other Images in This Article
Copyright and Terms & Conditions
© 2026. The Author(s). Published by the American Astronomical Society.