Image Details
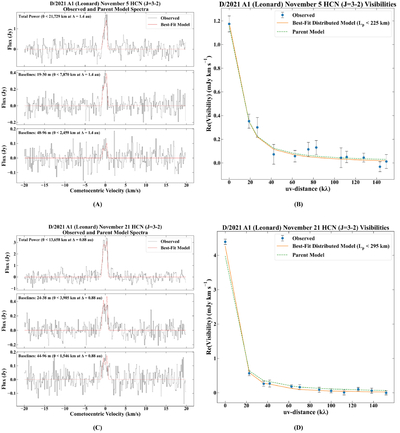
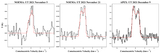
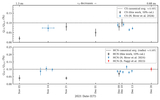
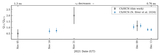
Caption: Figure 3.
(A) HCN (J = 3–2) spectrum of A1 on UT 2021 November 5 (black). The top panel shows the ON–OFF spectrum, while the lower two panels display spectra extracted over different baseline ranges (i.e., angular scales). The spectra are shown at a frequency resolution of 125 kHz (velocity resolution 0.15 km s−1). The best-fit model is overplotted in red. (B) Real part of the observed visibility amplitude as a function of projected baseline length for HCN on UT 2021 November 5. The parent model and the upper-limit distributed source model are overplotted for comparison. The uv-distance is given in units of kλ. (C)–(D) HCN spectra for November 21, with traces and labels as in (A)–(B).
Other Images in This Article
Copyright and Terms & Conditions
© 2026. The Author(s). Published by the American Astronomical Society.