Image Details
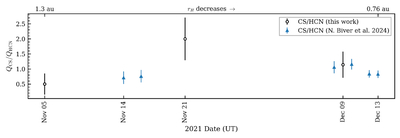
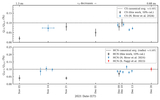
Caption: Figure 7.
Preperihelion time evolution (decreasing rH) of the CS/HCN mixing ratio in comet A1. Because the ratio does not rely on normalization to H2O, it provides a water-independent comparison of relative abundance variability. Black open symbols show results from this work. Blue-colored, solid symbols show contemporaneous measurements adopted from N. Biver et al. (2024). In November, for N. Biver et al. (2024), the CS abundance is taken as the weekly average value reported for Nov 13–16, and this same CS value is paired with the two HCN measurements within that window (November 14 and 16) to form CS/HCN. Shown error bars represent 1σ uncertainties that include an additional 10% contribution from the absolute flux-scale calibration to account for comparison between differing facilities.
Other Images in This Article
Copyright and Terms & Conditions
© 2026. The Author(s). Published by the American Astronomical Society.