Image Details
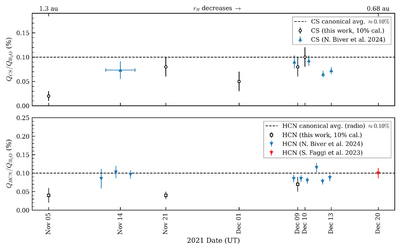
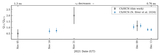
Caption: Figure 6.
Preperihelion time evolution (decreasing rH) of the CS (top) and HCN (bottom) mixing ratios relative to H2O in comet A1. Black open symbols show results from this work. Blue-colored, solid symbols show contemporaneous measurements adopted from N. Biver et al. (2024) while the red-colored, solid symbol shows measurements from S. Faggi et al. (2023). Shown error bars represent 1σ uncertainties that include an additional 10% contribution from the absolute flux-scale calibration to account for comparison between differing facilities. Dashed lines represent radio canonical average abundances from D. Bockelée-Morvan & N. Biver (2017).
Other Images in This Article
Copyright and Terms & Conditions
© 2026. The Author(s). Published by the American Astronomical Society.