Image Details
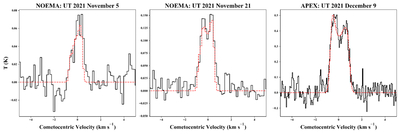
Caption: Figure 5.
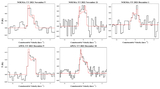
Evolution of the HCN (NOEMA: J = 3–2; APEX: J = 4–3) spectral line in comet A1. The black line depicts the extracted spectra, while the red line represents our modeled data. NOEMA spectra shown here are from the ON–OFF observations.
Other Images in This Article
Copyright and Terms & Conditions
© 2026. The Author(s). Published by the American Astronomical Society.
Copyright ©
2026 Astronomy Image Explorer. All Rights Reserved.