Image Details
Caption: Figure 6.
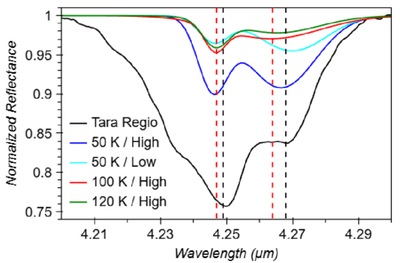
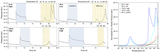
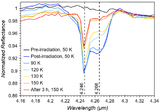
Comparison between the CO2 ν3 band observed by JWST at Tara Regio and the lab spectra of 10 keV electron-irradiated cryogenic CaCO3. The black line shows the continuum-normalized, five-point smoothed spectrum from the center of Tara Regio (16°S, 79°W), with dashed lines marking the band centers at 4.249 and 4.268 μm (S. K. Trumbo & M. E. Brown 2023). Overlaid are the double Gaussian fits to the postirradiation lab spectra. Red dashed lines at 4.247 and 4.264 μm mark the wavelengths at 100 K.
Other Images in This Article
Copyright and Terms & Conditions
© 2026. The Author(s). Published by the American Astronomical Society.
Copyright ©
2026 Astronomy Image Explorer. All Rights Reserved.