Image Details
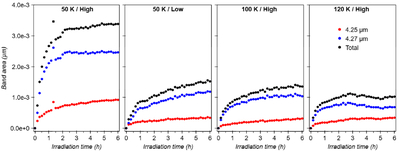
Caption: Figure 3.
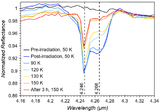
Evolution of the CO2 ν3 band area while irradiating CaCO3 at different temperatures and electron fluxes. Areas of the 4.25 μm (red) and 4.27 μm (blue) components, as well as their sums (black), are shown. Errors are within 0.001 μm. In all cases, the band area increases rapidly and then levels off. Total CO2 yield follows the trend 50 K/high flux > 50 K/low flux > 100 K > 120 K. The 4.27 μm component is the major contributor to the band area.
Other Images in This Article
Copyright and Terms & Conditions
© 2026. The Author(s). Published by the American Astronomical Society.
Copyright ©
2026 Astronomy Image Explorer. All Rights Reserved.