Image Details
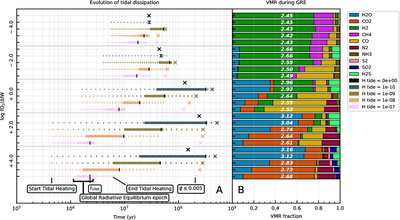
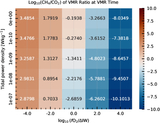
Caption: Figure 4.
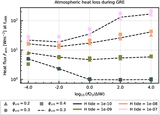
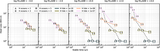
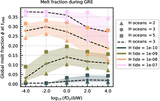
Evolution of nominal-composition cases across the full range of fO2 and tidal power densities simulated (see Section 2.3). Panel (A): stages in a planet’s lifetime after model initialization. Dotted lines trace cumulative tidal heat dissipation; marker size increases with total dissipated energy. Solid lines indicate tidally supported GRE states; black vertical bars (∣) mark tV MR. Crosses (×) denote solidification, defined at ϕ < 0.005. Panel (B): volume mixing ratios of volatiles at tV MR. White numbers show corresponding ﹩{\mathrm{log}}_{10}﹩ total surface pressure [bar].
Other Images in This Article
Copyright and Terms & Conditions
© 2026. The Author(s). Published by the American Astronomical Society.
Copyright ©
2026 Astronomy Image Explorer. All Rights Reserved.